Chart Patterns, Breakouts and Price Targets
Chart Patterns
There are many technical indicators that chartists use to try to predict the future price movements of stocks. The most popular include Bollinger Bands, Stochastics, Relative Strength Index, and Multiple Moving Averages. In my research I have found the problem with these indicators is they contradict each other and some are only good for trending stocks while others are only good for oscillating stocks. This is fine if the stock is consistently in one or the other but they tend to change at the drop of a hat. Instead I have found the best system is to just interpret the patterns in the candlestick charts themselves.
The best book I have read for understanding and trading chart patterns is Thomas Bulkowski’s Encyclopedia of Chart Patterns. Not only does Bulkowski explain each pattern but he provides statistics on the likelihood of success and failure of each pattern as well as how to set price targets.
Reversal and Continuation Patterns
There are two main categories of chart patterns: reversal and continuation. A reversal pattern reverses the prior trend while a continuation pattern should breakout and continues the prior trend. Three of my favorite patterns I like to trade are: cup and handle, head and shoulders, and triangles.
Cup and Handle
The cup and handle is a continuation pattern and is so named as it looks like a cup with a handle on it similar to a tea cup. The cup should form over a period of 5 – 8 weeks and then retrace approximately 30 – 50% of the prior up trend. The handle is formed when those who bought at the previous high start selling to breakeven after sustaining losses from the pullback into the cup. The handle should not retrace more than 50% of the depth of the cup. When the stock breaks out from the cup it is important for volume to be at least 50% higher than the average volume over the past 50 days. This confirms institutional support as per the CANSLIM rules. Buyers should be wary if the volume does not increase on the breakout from the pivot point. The pivot point is when the stock trades through the high formed at the beginning of the handle as per the chart below:
Head and Shoulders
The head and shoulders pattern is a reversal pattern and should have two distinct shoulders separated by a taller head in the middle. The stock should be sold short when the stock trades below the pivot point formed by the beginning of the right shoulder as per the chart below. An inverse head and shoulders pattern is an inverted head and shoulders pattern and should be bought when the stock trades above the pivot point formed at the beginning of the right upside-down shoulder.
(Click to enlarge)
Triangles, Ascending, Descending and Symmetrical
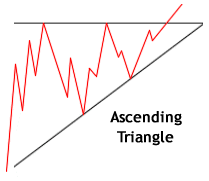
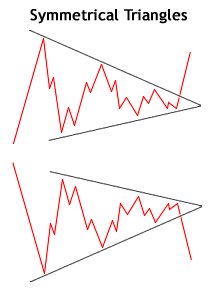
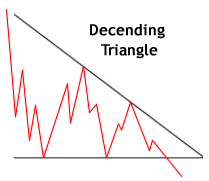
Triangles are continuation patterns and the three most common triangles are the as cending, the descending and the symmetric triangles.
The ascending triangle is continues an uptrend and should breakout to the upside. A breakout to the downside indicates a pattern failure and possibly a reversal to a downtrend.
The descending triangle is continues a downtrend and should breakout to the downside. A breakout to the upside indicates a pattern failure and possibly a reversal to an uptrend. The symmetrical triangle can form in either a down or uptrend and should breakout and continue the prior trend. However, the symmetrical triangle is most prone to failure and breaking out on the reverse side.
*Triangle pictures from www.investopedia.com
www.investopedia.com is a great resource on the internet for traders. Here they have descriptions of each pattern, including others such as double bottoms, flags, pennants, and wedges. There are also many articles on how to trade them, and many other trading related subjects.
Dan Zanger’s Chartpattern.com also has a great free resource for learning to recognize the most common chart patterns. He does not talk about setting price targets but at least gives a basic description of each of the main patterns. Here is a link to his website: www.chartpattern.com
Breakouts
The time I buy stocks is when they breakout from one of the above patterns that form over a 5-8 week solid base to (preferably) brand new highs. If not, then to at least a new 24 month high. This is contrary to popular belief that stocks should be bought low and sold high. The problem with this school of thought is that a company’s share price is trading at a low price for a reason – because the market believes it is what the company is worth – not as much as what it was. Instead, I buy high and sell higher. There is a good reason a stock is breaking out to a new high – the market believes a company is successful and in a financially very good position. I prefer to buy these sorts of companies rather than failing companies trading at a discount.
Price Targets
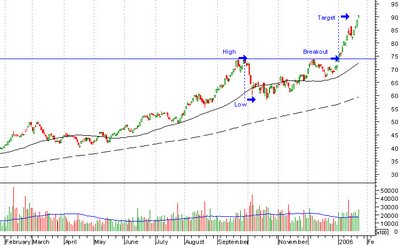
A price target is the estimated price a chart stock should reach after breaking out of a price pattern. The most common method to project price targets is to measure the height of the pattern and add (or subtract for a downwards breakout) the figure to the breakout point.
Let’s look at this chart of a cup and handle as an example: a trader is able to identify a cup and handle pattern. The target of $90.12 is measured by adding the height of the pattern of $15.92 ($73.95 – $58.03).
(Click to enlarge)
To show an example of a breakout to the downside lets look at this chart of a head and shoulders pattern. The target of $38.43 is measured by adding the height from the head to the inner right shoulder of $7.78 ($53.99 – $46.21) and projecting it down from the breakout point.
(Click to enlarge)
In Bulkowski’s book Encyclopedia of Chart Patterns he states that price targets are only reached approximately 50% of the time before a pullback to the breakout point. However, half the height of the price target is reached 70% of the time before a pullback to the breakout point. I tend to sell a third of my position at this point to ensure a profit, incase the price does pull back and I get stopped out. it is better to make a partial profit then risk it all and end up being stopped out with a loss.
The easiest part to share trading is buying the stock. The hardest part is knowing when to sell. It is important to set a price target to know when to sell but it is even more important to use Position Sizing and Stop Losses.
*Please leave any comments you may have at Reeholio Stock Market Trading Home Page


